
Canadian Home Sales Climbed in June: CREA Stats

The Canadian Real Estate Association’s (CREA) new statistics show national home sales had minor changes in June 2019 from the previous month. Following a string of monthly gains recorded in March, April and May, home sales recorded by the Canadian MLS Systems were little changed in June 2019.
The CREA attributes June’s nearly unchanged national tally to the result of an even split between the number of local markets where sales were up, and those where they were down.
According to the statistics, larger monthly gains were generally focused in the province of Québec and Southern Ontario.
Those gains were offset by declines in markets across Canada, including Greater Vancouver (GVA), Calgary, Halifax-Dartmouth and the province of Newfoundland and Labrador.
Non-seasonally-adjusted sales activity edged up 0.3 per cent, compared to June 2018, with gains in Greater Toronto (GTA) and Montréal offsetting declines in B.C.

“Sales activity is strong in New Brunswick where I do business, but it’s a very different story in B.C., Alberta and Saskatchewan,” said Jason Stephen, CREA’s President. “All real estate is local. Nobody knows that better than a professional realtor, who is your best source for information and guidance when negotiating the sale or purchase of a home.”
Gregory Klump, CREA’s Chief Economist, states that there’s a growing divergence in Canadian housing market trends between eastern and western Canada.
“While sales activity in Canada’s three westernmost provinces appears to have stopped deteriorating, it will be some time before supply and demand there becomes better balanced and the outlook for home prices improves,” said Klump.
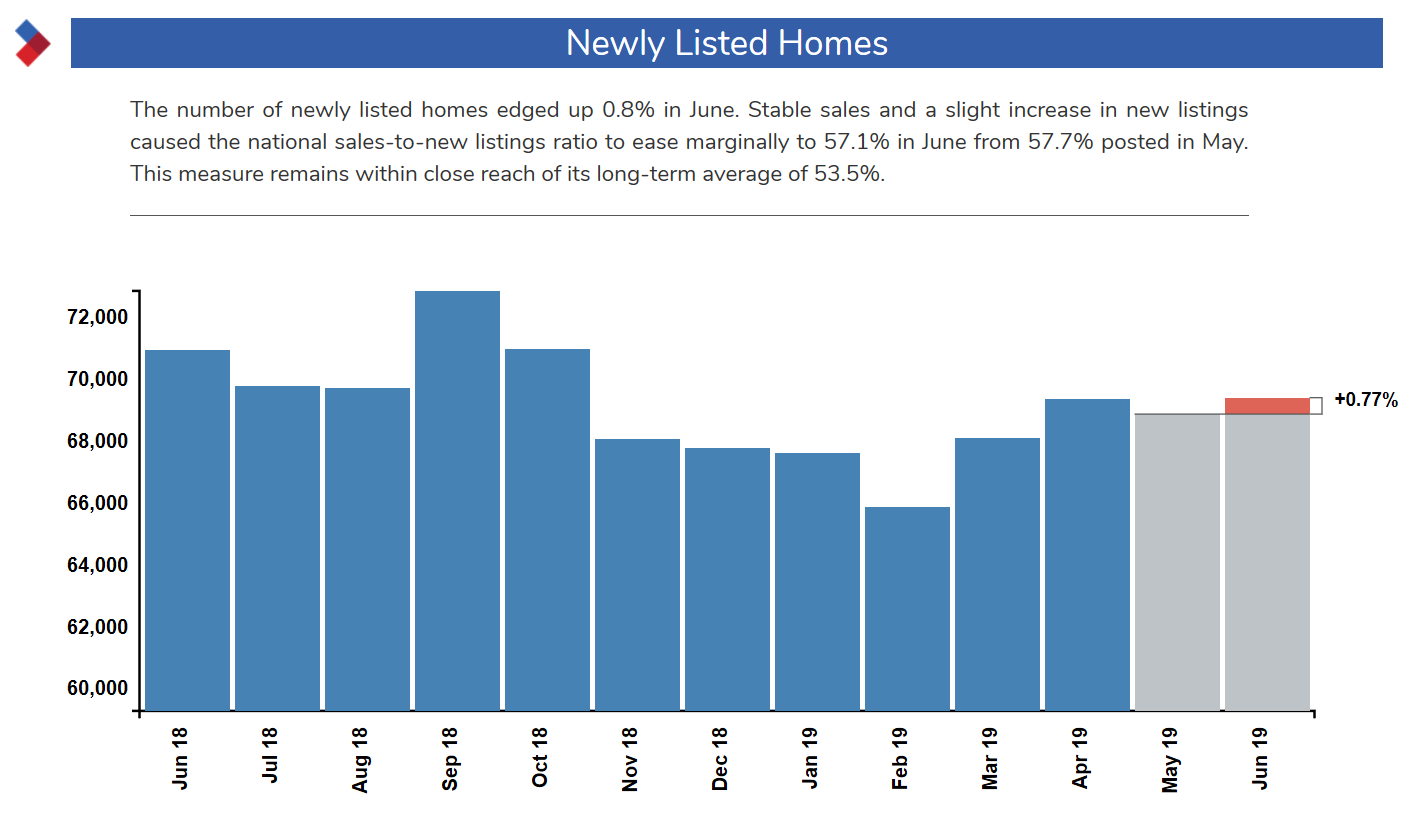
The CREA reports that the number of newly listed homes edged up 0.8 per cent in June.
Stable sales, and a slight increase in new listings, caused the national sales-to-new listings ratio to ease marginally to 57.1 per cent in June from 57.7 per cent posted in May.
This measure remains within close reach of its long-term average of 53.5 per cent, according to the statistics.
Based on a comparison of the sales-to-new listings ratio with the long-term average, over 80 per cent of all local markets were in balanced market territory in June 2019, which the CREA reports as the largest share in over three years.
There were five months of inventory on a national basis at the end of June 2019. Although the CREA says this is its lowest level since January 2018, this measure of market balance remains within close reach of its long-term average of 5.3 months.
While national measures of market balance are close to their long-term averages, the CREA reports significant regional variations.
The number of months of inventory has inflated far beyond long-term averages in Prairie provinces and Newfoundland & Labrador.
“The measure remains well below long-term averages in Ontario and the Maritime provinces, resulting in increased competition among buyers for listings and fertile ground for price gains,” said the CREA.
Although the seasonally adjusted Aggregate Composite MLS HPI rose 0.3 per cent in June 2019, the CREA says it was still running 1.1 per cent below the peak reached in December 2018.
Looking past monthly variations, the overall trend has remained stable since March, amid divergent regional trends.
With essentially all of the gains recorded in housing markets east of the Prairie region, seasonally adjusted MLS HPI readings in June were up from the previous month in nine of the 18 markets tracked by the index.
The CREA’s statistics reveal flat prices on a m-o-m basis in Vancouver Island, Calgary, Edmonton, Regina, Saskatoon and Moncton.
Material declines were limited to the GVA (-1.3 per cent), the Fraser Valley (0.8 per cent) and the Okanagan Valley (-0.5 per cent).
Monthly gains were posted in Barrie (+1.4 per cent), Hamilton (+1.3 per cent), Niagara (+1.2 per cent), Guelph (+1.1 per cent), Ottawa (+0.7 per cent), Greater Montréal (+0.7 per cent), the GTA (+0.6 per cent) and Oakville (0.3 per cent).
Non-seasonally-adjusted Aggregate Composite MLS Home Price Index (MLS HPI) edged down by -0.3 per cent y-o-y in June 2019.
Two-storey single-family home edged back 0.1 per cent last June. As reported by the CREA, one-storey single-family home prices posted the largest y-o-y decline (-0.8 per cent) among benchmark property categories.
Meanwhile, townhouse/row prices were down by 0.7 per cent y-o-y, and apartment unit prices edged back by 0.4 per cent.
In British Columbia, prices are down on a y-o-y basis in Greater Vancouver (-9.6 per cent), the Fraser Valley (-6.6 per cent) and the Okanagan Valley (-0.8 per cent). Victoria prices edged up 0.5 per cent and climbed 4.2 per cent elsewhere on Vancouver Island.
Among Greater Golden Horseshoe housing markets tracked by the index, MLS HPI benchmark home prices were up from levels last year in Guelph (+6.8 per cent), the Niagara Region (+6.7 per cent), Hamilton-Burlington (+5.4 per cent), the GTA (+3.6 per cent) and Oakville-Milton (+3 per cent). Home prices in Barrie held below year-ago levels at -2.4 per cent.
Supply remains elevated relative to sales across the Prairies, and home prices remain below year-ago levels.
Benchmark prices were down by 3.9 per cent in Calgary, 3.2 per cent in Edmonton, four per cent in Regina and 1.1 per cent in Saskatoon.
“The home pricing environment will likely remain weak in these cities until demand and supply return to better balance,” said the CREA.
Home prices rose 8.3 per cent y-o-y in Ottawa (led by a 13.2 per cent increase in townhouse/row unit prices), 6.7 per cent in Greater Montréal (led by an 8 per cent increase in apartment unit prices), and 1.3 per cent in Greater Moncton (led by an 18.4 per cent increase in apartment unit prices).
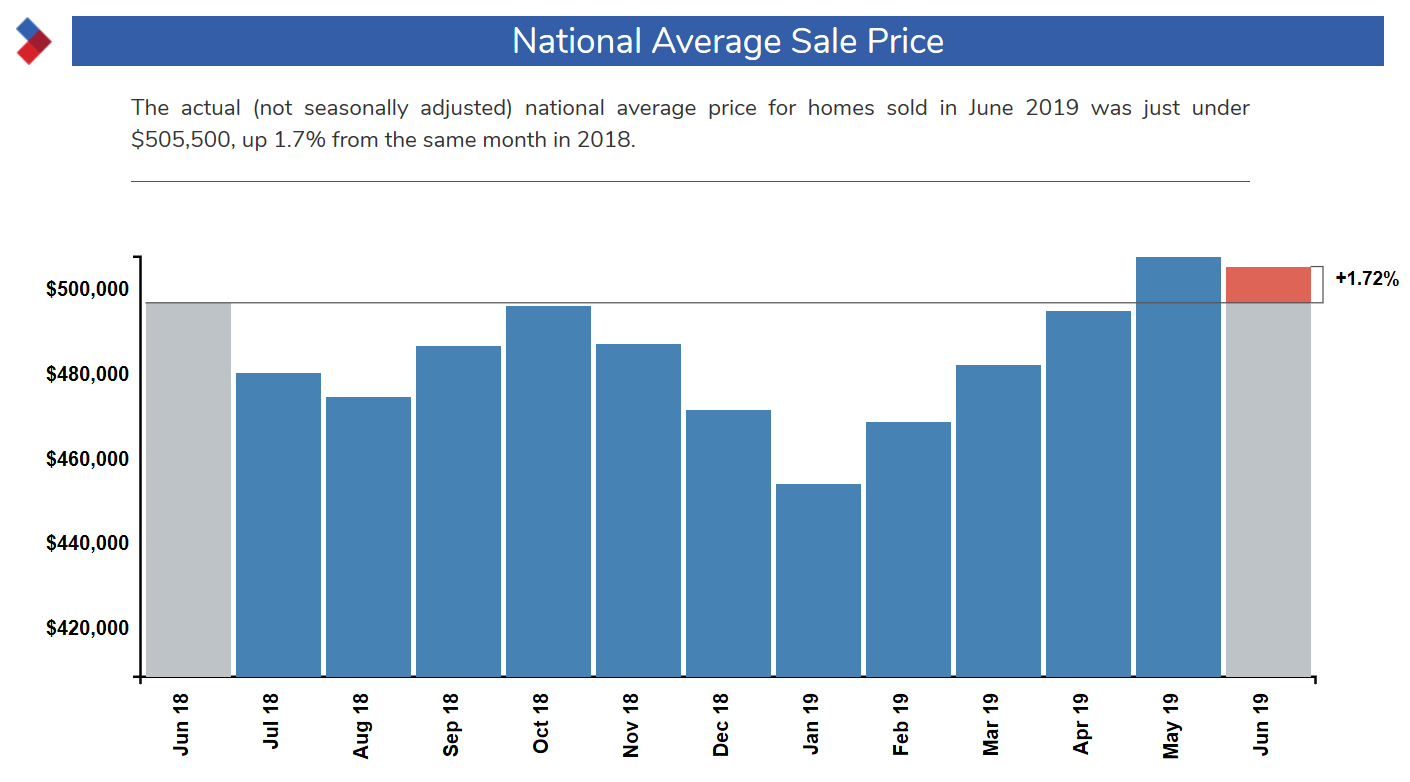
The actual national average price for homes sold in June 2019 (not seasonally adjusted) was just under $505,500, up 1.7 per cent from the same month in 2018.
According to the CREA, the national average price favours sales in the GVA and GTA, two of Canada’s most active and expensive housing markets.
The CREA suggests that excluding these two markets from calculations cuts almost $106,000 from the national average price to fewer than $400,000.